
EasyData Pivot Table Tool
View Your Data in a Table
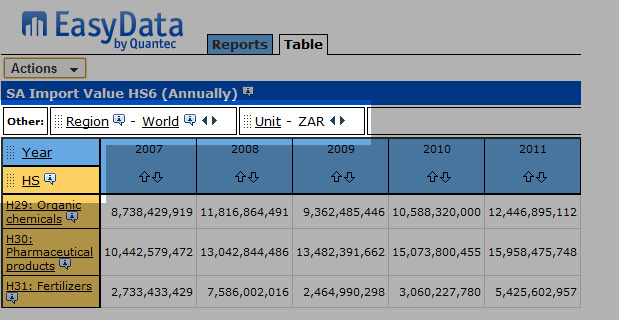
A Table View displays your report in the form of a table. You can perform the following tasks in a table view:
1. Customise Your Report Dimensions
The dimension area appears at the top of a table view, just below the tabs.
Dimension tiles can be dragged and dropped.
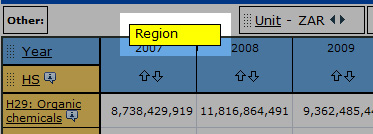
Dimension names are underlined. Clicking on a dimension name opens the Item List page so you can choose different items for the dimension.
If the name of a dimension item is underlined, the item represents a group. Click on the underlined item name to drill into the group and view its members.
Other dimensions do not appear on the rows or columns of a report, but their data is included in the calculation of the report's data values. The Other dimensions are at the top of the dimension area. They have a white background.
The name of the currently active item appears on the right-hand side of an Other dimension tile. Clicking on the Next Item and Previous Item arrows cycles through all the items in the dimension. The report's data values change to reflect the item that is currently active.

The Column dimension(s) have a blue background and are below the Other dimensions. Column dimension items run along the top of the data area.
The Row dimension(s) have a yellow background and are below the column dimension. Row dimension items run down the left-hand side of the data area.

2. Move Dimensions
Dimensions can be moved by dragging and dropping them. Click and hold on the dots next to the dimension name to drag and drop a dimension.
Switching two dimensions
Switching dimensions exchanges their positions. You can switch any dimension with any other.
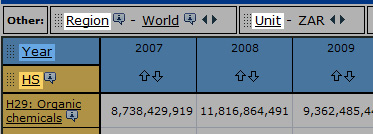
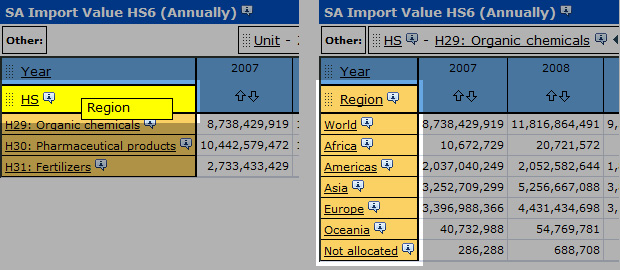
To switch dimensions, drag and drop one dimension onto another. The underlying dimension changes colour to show that the dragged dimension can be dropped. In the following screenshot, an Other dimension has been dragged to the column dimension area. The column dimension has changed colour to show that you can drop the dragged dimension onto it and switch their places.
Nesting dimensions
Nesting dimensions places one dimension inside another. It allows a report to have more than one row or column dimension at a time.
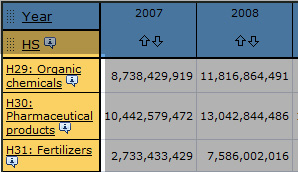
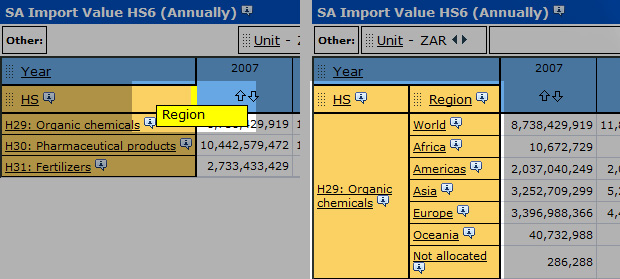
Nest dimensions by dragging and dropping. The underlying dimension changes colour on one edge only, to indicate where the nested dimension will appear. In the screenshot below, an Other dimension has been dragged to the right edge of the row dimension. The right edge of the row dimension has changed colour to show that the dragged dimension can be dropped and nested into it.
3. Drill Down Into a Group
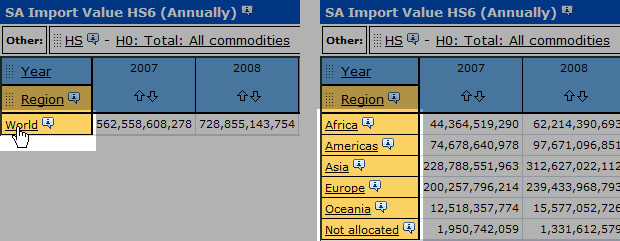
Items that define a group appear underlined in an EasyData report.
To drill down into a group, click on its name. Drilling into a group creates a new report containing only the group members.
Note: To drill back up out of a group, use your browser's Back button.
4. Download Your Report
When your report looks the way you want it to look, you can download it to your computer. Click the 'Actions' button, then click 'Download report data...' and select the file format you wish to download.
