EasyData Pivot Table Tool
Find, Customise & Download a Report
The above video explains step-by-step how to create and download a report of South African imports from various regions using the EasyData Pivot Table Tool.
The EasyData Pivot Table Tool helps you create customised reports that show your data the way you want to see it. You can download these reports to your computer in Microsoft Excel and other formats.
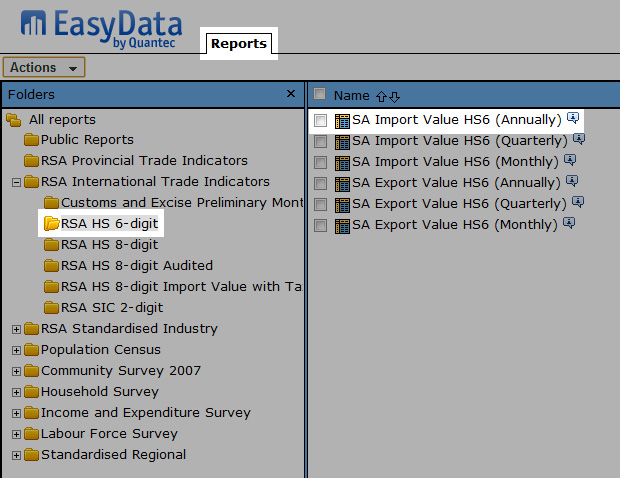
1. Find a Report
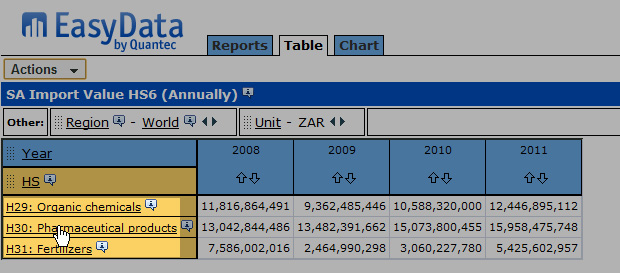
Use the Reports tab to look for a report on the Report Folders Page. When you find a report that contains the data you want to work with, click the report's name to open it.
2. Customise Your Report
Once you have found a report and opened it, you can customise it in many ways:
Move dimensions around among the row column, and other dimension areas.
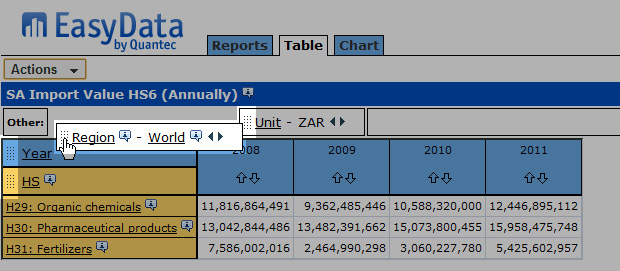
View all the possible items for every dimension, and choose the ones you want to have in your report.
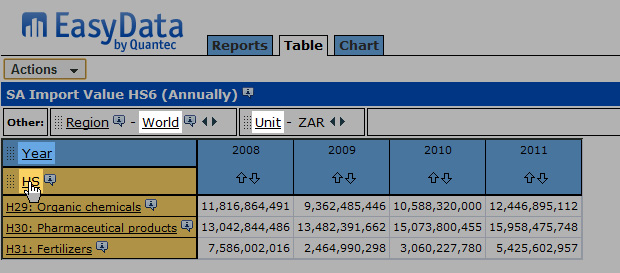
Drill into a group to reveal the group members.
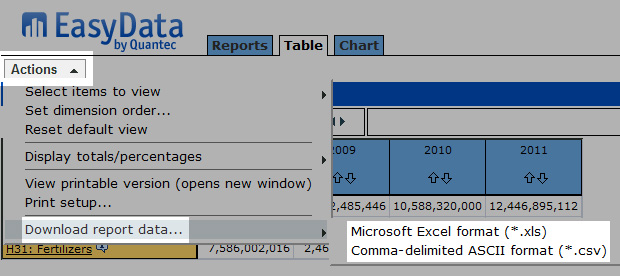
3. Download Your Report
When your report looks the way you want it to look, you can download it to your computer. Click the 'Actions' button, then click 'Download report data…' and select the file format you wish to download.